Health Studies Show that Very Low Sodium Intakes Can be Harmful
This is a classic case of what regularly happens in the human health arena. One study highlights a problem, the lemmings all get funded to show that same thing. Someone steps back and says “Hang on a minute”, “Maybe we should check this out, properly”.
Their new study refutes the original conclusion, but the lemmings and various health authorities won’t listen. The weight of evidence wins out. Besides, it’s too expensive to pulp all the brochures.
The health benefits of reducing salt (sodium chloride) consumption in diets have long been accepted. The need to lower salt, especially sodium intake, is widely promoted via various health authority advertisements.
However, several recent major studies have bucked the trend and gone against the dogma. These studies found that people with the lowest sodium intakes actually had the worst cardiovascular outcomes. Strange but true!
It appears that there is a middle ground. People with very high salt consumption also had higher risk of dying sooner, The middle ground ('everything in moderation') appears to be the healthiest. Claims about the need for low calorie diets appear to be ‘making a mountain out of a molehill'.
This article reviews the latest studies to shed light on how salt and sodium intake affects health and how the truth needs to be revealed and confirmed.


An Australian study of the salt intake of more than 600 elderly type-2 diabetic patients over a 10 year period found that patients who ate less salt, had higher mortality rates. For every extra 2.3g of sodium (about one teaspoon of salt) in the urine of patients their risk of dying fell by about 30 per cent. Patients who ate more salt tended to be fatter, but fewer of them died from heart disease and stroke over the 10 year period of the study.
Recent data are very confusing with conflicting outcomes. About seven recent studies have shown a correlation between increased salt intakes and increased death rates. However, more than twice as many studies have found either no link between low salt and mortality rates or the opposite finding - that increased salt was associated with
Outcomes of Recent Research
- An earlier study, published in 1985 on Japanese immigrants in Hawaii, examined the relationship between sodium intake and subsequent deaths due to heart disease problems. The study failed to show a confirmed relationship between sodium intake and health outcomes. This was one of the studies focused on sodium intake.
- An Australian study of 4000 patients admitted to a clinic, who had all had the sodium in their urine measured, found that people with the lowest sodium intake had the worst cardiovascular outcomes.
- A Fiinish study of about 2800 people with type-1 diabetes, found best survival rates for those with moderate salt consumption. The groups with the lowest and highest sodium consumption rates had higher mortality rates.
- A study of 28,800 Canadians found similar results to that for the Finnish Study – higher mortality rates for the groups with the highest and lowest salt consumption. The impact of extra salt did not occur until it was 3-4 times higher than the recommended intake. The low consumption rates were well within the range currently recommended by health authorities. Both high and low salt consumption groups suffered more cardiovascular events.
- A study of about 3600 Europeans, who showed no evidence of heart disease, found a mortality risk of about 1% for those with the highest salt consumption, but 4% in those with the lowest salt consumption.
- A series of seven randomised controlled studies by the non-profit Cochrane Collaboration supported these finding for a group of 6200 subjects. These studies showed no clear evidence that linked salt intake to mortality or heart disease incidence.
- A major review of 163 studies by the Cochrane Collaboration group found evidence that reduced salt intake appeared to be harmful for patients with heart problems and these with type 1 and 2 of diabetes. After reviewing more than 150 controlled studies and 13 population studies they found no conclusive evidence in favour of sodium reduction decreasing mortality.
So Why the Conflict? Why isn’t the Research More Conclusive?
It appears that this is a classic case of using data to show an association or correlation without demonstrating cause and effect. It is likely that there are many other factors involved that confound the research outcomes, despite the efforts to control them.
Many of the leading researches on salt effects admit there is no direct evidence that reducing salt intake directly saves lives. Various inferences can be made such as reducing salt may help to reduce blood pressure and this in turn may reduce the risk of death from heart related problems, stroke and kidney failure. But once again it is all supposition and not proven conclusively.
There is much stronger evidence that blood-pressure-lowering drugs save lives, because it is easier to do the research and there is more funding available from the drug companies. One reason the same assurance cannot be applied to salt reduction is there's no money in it. Advertisers aren’t going to get lucrative contracts from marketing salt-reduced food. But they will continue to get contracts for advertising processed foods that sell well because they have lots of salt added to make them palatable.
One of the unusual problems with salt research is that many people who are asked to adopt a low-salt diet – hate it, and drop out of the study. One approach is to add potassium to the sodium, as there
is research showing that the potassium to sodium ratio is more important than the sodium level itself.
A major research Australian study that has just started, may finally provide some answers. It will be based in northern China and will involve 360 villages. Half the villages will get normal salt and the other half will get a salt mixture containing 10% magnesium chloride and 30% potassium chloride. This mixed ion salt will taste the same, but will have much less sodium. The mortality and health statistics for the 700,000 people in the villages will be monitored over a four year period.
Are the Salt Reduction Targets Realistic and not Risky?
In Australia the dietary target is about 4 g of salt a day, which is equivalent to almost one single teaspoon of salt. Most Australians consume about 10 g of salt per day (2 1/2 times as much. But the 4 g target (40% of current levels) is within the range than many studies suggested could increase mortality risks.
It has been claimed that humans evolved to live on a diet of less than 1 g of sodium a day (10% of what we ea now). The average American consumes about 3.4 grams of sodium, or 8.5 grams of salt, a day. So there is clearly a huge mismatch between the amount of salt and sodium we eat now and the recommended amounts.
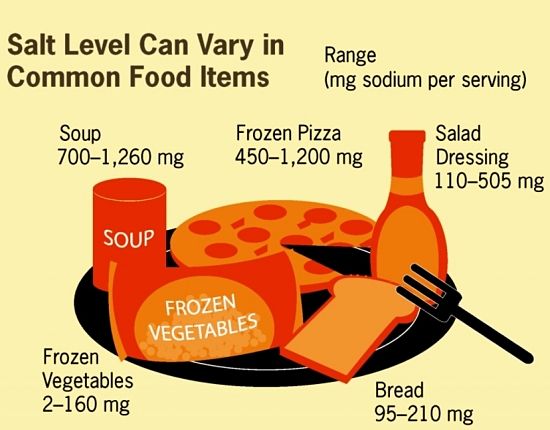
The two table below summarize the salt and sodium level in a wide variety of foods compared with the recommended daily allowance. This shows that most people exceed the recommended levels by simply eating what is considered a 'normal diet'. This situation mirrors the argument about obesity and calorie intake.
A recent major study found that the majority of people are overweight or obese because they 'passively' eat too many calories. The highly processed foods such as breads and dairy products are manufactured to have very high levels of calories, because that is what people want (supposedly). Most people don't get fat because they eat junk food, but because they eat too much normal food which is calorie dense. The same applies to salt which is added to foods to make them more palatable. People get too much salt by eating 'normal' foods not junk foods.
The conclusion is that we need better and more definitive research on the relationship between salt and sodium and health and what levels are safe. The research needs to establish cause and effect not simple correlations.
Salt Content of Popular Foods
|
Food Type
|
Product
|
Child Serving
|
Salt (g)
|
Adult Serving (g)
|
Salt (g)
|
Percent of Weight that is Salt
|
Tsp of Salt (adult serving)
|
|---|---|---|---|---|---|---|---|
|
Cereals
|
Coco Pops
|
30
|
0.5
|
120
|
2
|
1.7
|
0.4
|
|
Nestle Shreddies
|
30
|
0.5
|
120
|
2
|
1.7
|
0.4
|
|
|
Muesli
|
35
|
0.08
|
140
|
0.3
|
0.2
|
0.1
|
|
|
Cornflakes
|
40
|
1
|
160
|
4
|
2.5
|
0.7
|
|
|
Processed Foods
|
White bread (4 slices)
|
100
|
1.3
|
400
|
5.2
|
1.3
|
0.9
|
|
Shepherds pie
|
200
|
2
|
800
|
8
|
1
|
1.4
|
|
|
Baked beans
|
225
|
2.98
|
900
|
11.9
|
1.3
|
2.1
|
|
|
Chicken curry
|
200
|
2.25
|
800
|
9
|
1.1
|
1.6
|
|
|
French fries
|
100
|
2
|
400
|
8
|
2
|
1.4
|
|
|
Pizza (1 slice)
|
225
|
4.1
|
900
|
16.4
|
1.8
|
2.9
|
|
|
Tomato ketchup
|
5
|
0.2
|
20
|
0.8
|
4
|
0.1
|
|
|
Cream of tomato soup
|
202
|
2.5
|
808
|
10
|
1.2
|
1.8
|
|
|
Instant sachet soup
|
25
|
2.2
|
100
|
8.8
|
8.8
|
1.5
|
|
|
Spaghetti hoops
|
210
|
2
|
840
|
8
|
1
|
1.4
|
|
|
Snacks
|
Twiglets
|
30
|
1.27
|
120
|
5.1
|
4.2
|
0.9
|
|
Dry roasted peanuts
|
30
|
0.59
|
120
|
2.4
|
2
|
0.4
|
|
|
Crisps
|
30
|
0.5
|
120
|
2
|
1.7
|
0.4
|
|
|
Salted peanuts
|
30
|
0.3
|
120
|
1.2
|
1
|
0.2
|
|
|
Biscuits and Cakes
|
Jaffa cakes (2)
|
25
|
0.2
|
100
|
0.8
|
0.8
|
0.1
|
|
Chocolate digestive (2)
|
30
|
0.33
|
120
|
1.3
|
1.1
|
0.2
|
|
|
Flapjack
|
100
|
0.7
|
400
|
2.8
|
0.7
|
0.5
|
|
|
Chocolate cake (slice)
|
37
|
0.39
|
148
|
1.6
|
1.1
|
0.3
|
|
|
Milk chocolate
|
30
|
0.06
|
120
|
0.2
|
0.2
|
0.1
|
|
|
Plain sponge cake (slice)
|
37
|
0.32
|
148
|
1.3
|
0.9
|
0.2
|
|
|
Cheese and Spreads
|
Mozzarella
|
30
|
0.45
|
120
|
1.8
|
1.5
|
0.3
|
|
Cheddar cheese
|
30
|
0.5
|
120
|
2
|
1.7
|
0.4
|
|
|
Cottage cheese
|
30
|
0.26
|
120
|
1
|
0.9
|
0.2
|
|
|
Slightly salted butter
|
7
|
0.13
|
28
|
0.5
|
1.9
|
0.1
|
|
|
Sunflower spread
|
10
|
0.17
|
40
|
0.7
|
1.7
|
0.1
|
|
|
Fish and Meat
|
Cod fish fingers
|
90
|
0.8
|
360
|
3.2
|
0.9
|
0.6
|
|
Fresh salmon (cooked)
|
100
|
0.13
|
400
|
0.5
|
0.1
|
0.1
|
|
|
Smoked salmon
|
56
|
2.5
|
224
|
10
|
4.5
|
1.8
|
|
|
Beefburger
|
100
|
2
|
400
|
8
|
2
|
1.4
|
|
|
Chicken nuggets
|
100
|
1.27
|
400
|
5.1
|
1.3
|
0.9
|
|
|
Pork sausages (grilled)
|
126
|
3.4
|
504
|
13.6
|
2.7
|
2.4
|
|
|
Ham
|
40
|
1.2
|
160
|
4.8
|
3
|
0.8
|
|
|
Bacon rasher (uncooked)
|
40
|
1.75
|
160
|
7
|
4.4
|
1.2
|
|
|
Chicken breast (uncooked)
|
100
|
0.13
|
400
|
0.5
|
0.1
|
0.1
|
|
|
Pork (uncooked)
|
100
|
0.15
|
400
|
0.6
|
0.2
|
0.1
|
|
|
Lamb (uncooked)
|
100
|
0.07
|
400
|
0.3
|
0.1
|
0.1
|
|
|
Beef (uncooked)
|
100
|
0.15
|
400
|
0.6
|
0.2
|
0.1
|
Sodium Content of Popular Foods Listed from Highest to Lowest
|
Food
|
Serving Size
|
Sodium (mg) - (1 level teaspoon of salt = 2000mg sodium)
|
% Daily allowance - Adult (1500 mg)
|
% Daily allowance - Child (1000 mg)
|
|---|---|---|---|---|
|
Gravy Powder
|
100g
|
6020
|
401%
|
602%
|
|
Soup, Dry Mix
|
100g
|
4449
|
297%
|
445%
|
|
Tinned tomato soup
|
one bowl
|
1125
|
75%
|
113%
|
|
Sauce [Recipe Base - wet dry)
|
100g
|
1046
|
70%
|
105%
|
|
Pasta, Dry Mix
|
100g
|
831
|
55%
|
83%
|
|
Salad Dressing
|
100g
|
819
|
55%
|
82%
|
|
Bakery Biscuit, Savoury
|
100g
|
805
|
54%
|
81%
|
|
Biscuit, Savoury, Puffed Corn
|
100g
|
800
|
53%
|
80%
|
|
Bacon
|
2 rashers
|
800
|
53%
|
80%
|
|
Sausage Roll
|
100g
|
660
|
44%
|
66%
|
|
Chicken,Nuggets
|
100g
|
625
|
42%
|
63%
|
|
Potato, Crisp Extruded Snacks
|
100g
|
620
|
41%
|
62%
|
|
Pizza
|
100g
|
604
|
40%
|
60%
|
|
Falafel
|
100g
|
581
|
39%
|
58%
|
|
Foods Popcorn
|
100g
|
516
|
34%
|
52%
|
|
Peanut Butter
|
100g
|
510
|
34%
|
51%
|
|
Spring Roll
|
100g
|
501
|
33%
|
50%
|
|
Mayonnaise
|
100g
|
483
|
32%
|
48%
|
|
Pie, Meat
|
100g
|
481
|
32%
|
48%
|
|
Croissant
|
100g
|
475
|
32%
|
48%
|
|
Margarine Spread
|
100g
|
448
|
30%
|
45%
|
|
Noodles with Vegetables
|
100g
|
444
|
30%
|
44%
|
|
Pastry
|
100g
|
432
|
29%
|
43%
|
|
Fish
|
100g
|
418
|
28%
|
42%
|
|
Doughnuts
|
100g
|
408
|
27%
|
41%
|
|
Bread
|
2 slices
|
400
|
27%
|
40%
|
|
Dumpling, Savoury
|
100g
|
376
|
25%
|
38%
|
|
M uffin, Sweet
|
100g
|
366
|
24%
|
37%
|
|
Cornflakes
|
one bowl
|
360
|
24%
|
36%
|
|
Pancake/Pikelet
|
100g
|
359
|
24%
|
36%
|
|
Pork, W th Sweet Sour Sauce
|
100g
|
348
|
23%
|
35%
|
|
Cake, Shelf Stable
|
100g
|
310
|
21%
|
31%
|
|
Danish Pastry
|
100g
|
272
|
18%
|
27%
|
|
Potato Crisps
|
1 packet
|
270
|
18%
|
27%
|
|
Pastry, Tart
|
100g
|
240
|
16%
|
24%
|
|
Snack Bar
|
100g
|
232
|
15%
|
23%
|
|
Biscuit, Sweet
|
100g
|
229
|
15%
|
23%
|
|
Potato, Chips or Fries
|
100g
|
182
|
12%
|
18%
|
|
Snack Muesli Bar
|
100g
|
132
|
9%
|
13%
|
|
Spread, Sweet
|
100g
|
47
|
3%
|
5%
|
|
Muesli, Toasted
|
100g
|
33
|
2%
|
3%
|